Recently I starting to do some projects using some datasets on Maven Analytics. This will help add to portfolio and practice some of the techniques that were picked up from the Maven analytics course. For this project Power BI was used.
1. Clean, Connect and Profile the Data
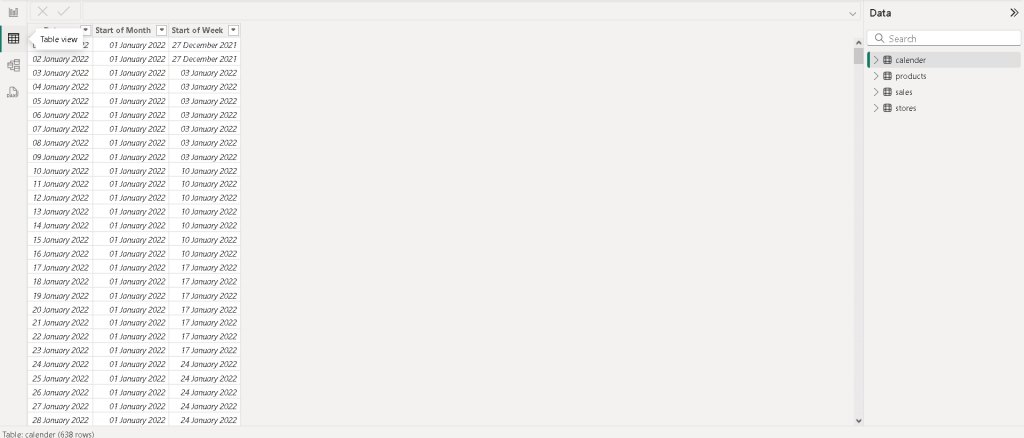
Firstly the data was cleaned up excel using data formatting on the dates in the calendar CSV file. Once the CSV are cleaned, it taken into Power ready to be connected.
Once the data is connected , the files are checked for errors and blanks. Afterwards two columns containing the start of the month & week is added.
2. Create a Relational Model
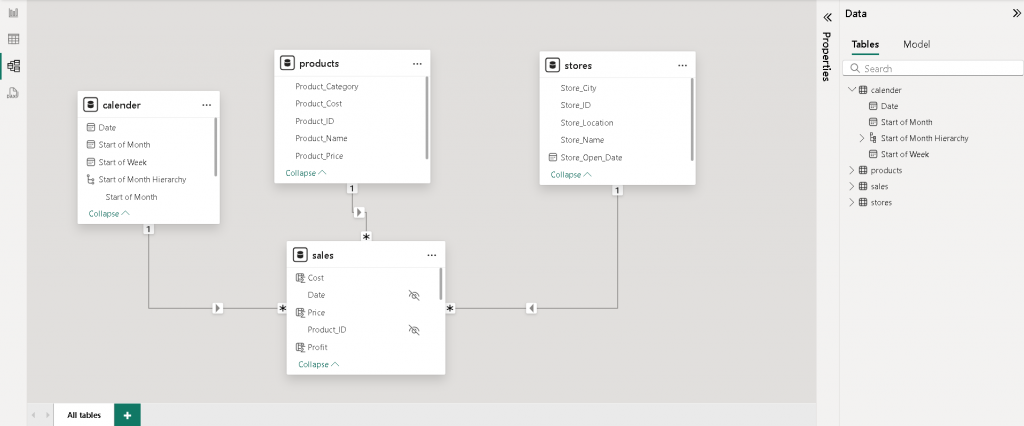
The next step is at add a relational model by connecting the sales , products and store and calendar tables together. After that a data hierarchy is added which will be used later on.
3. Calculated Measure & Fields
Some new measures and fields such total orders, sum of revenue and sum of profit are added to field tables. This will be used for final analysis in the interactive report later on.
4. Building an Interactive Report
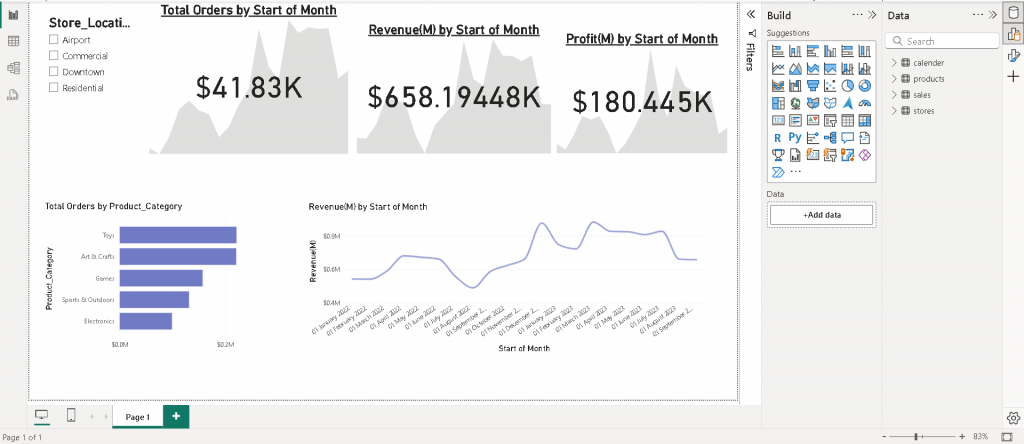
The data is visualized using a dashboard in power bi. The board shows the orders, revenue and profit over time and by product category.