In this project the aim is to build an interactive dashboard to observe and analyze coffee shop sale prices.
- Preparing the Data for Analysis
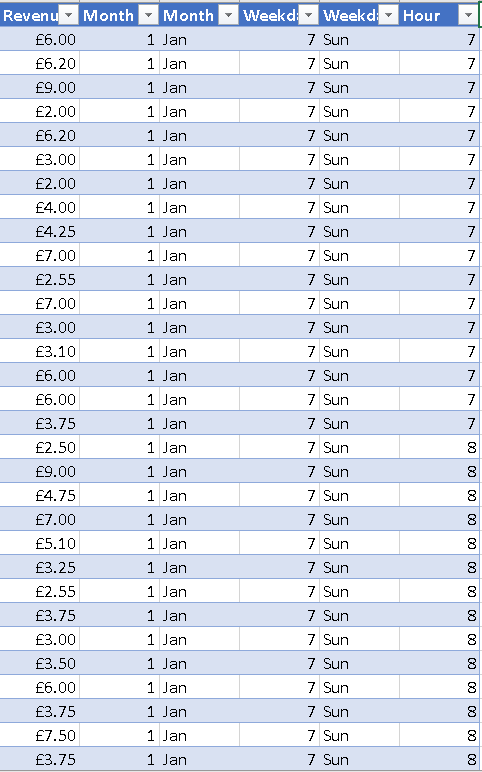
The coffee shop dataset is observed by checking transactions that were recorded over a period of time. Also the number of products and Categories sold was noted. Afterwards a new column was added to calculate Revenue. Additionally the Month, Day of Week and Hours were added.
2. Explore the Data using Pivot Tables
The next task was to create a pivot table that allow the data to be sliced for simplicity. With data organized in a table it is ready to be used in the dashboard.
3. Create the Dashboard
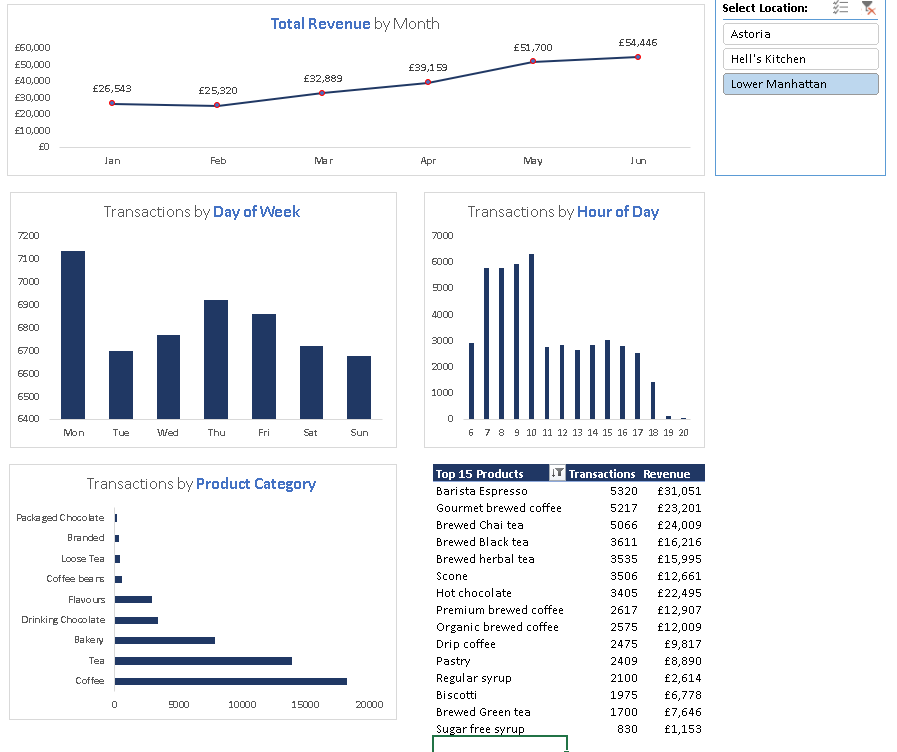
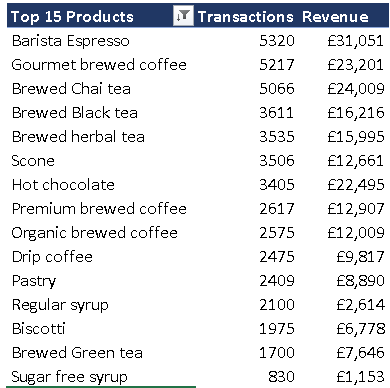
The final step was to create a dashboard to visualize the data. First step was to create Pivot charts to show the Total Revenue by Month, Transactions by Day of the Week, Transactions by Hour of day and Transactions by Product Category. The charts are assembled into a rough dashboard format and contains a table showing the top 15 products types.
A slicer was added for store location location which allows the data and visualization to be updated for each location. From the end result patterns and trends can be observed.